

Can machine learning algorithms predict cryptocurrency price crashes? This question sits at the heart of a complex debate within the volatile world of digital assets. The inherent unpredictability of cryptocurrency markets, influenced by everything from social media sentiment to regulatory shifts, presents a significant challenge for even the most sophisticated predictive models. This exploration delves into the capabilities and limitations of machine learning in forecasting these dramatic market events, examining the data sources, model training processes, and ethical considerations involved.
We’ll also explore alternative approaches and emerging technologies that may offer a clearer picture of future market behavior.
The cryptocurrency market’s volatility, driven by factors like news cycles, social media trends, and regulatory changes, makes accurate price prediction exceptionally difficult. Machine learning algorithms, while powerful, struggle with this inherent uncertainty. This analysis will examine various approaches, including different machine learning algorithms and the crucial role of data quality and feature engineering in improving predictive accuracy. We’ll also assess the ethical implications of using these models for financial forecasting.
Limitations of Machine Learning in Predicting Cryptocurrency Crashes

Predicting cryptocurrency price crashes using machine learning algorithms presents significant challenges due to the inherent volatility and complexity of the cryptocurrency market. While machine learning can identify patterns and trends, the unpredictable nature of this asset class often renders these predictions unreliable. Several factors contribute to this limitation, hindering the accuracy and effectiveness of even the most sophisticated models.The inherent volatility of cryptocurrency markets significantly impacts the accuracy of predictive models.
Unlike traditional financial markets, cryptocurrency prices are known for their extreme price swings, often experiencing dramatic increases and decreases within short periods. This high volatility introduces significant noise into the data used to train machine learning models, making it difficult for these models to discern meaningful patterns from random fluctuations. The sheer unpredictability makes it hard for algorithms to reliably identify precursors to a crash.
Influence of External Factors on Price Prediction
News events, social media sentiment, and regulatory changes exert considerable influence on cryptocurrency prices, posing significant challenges for machine learning models. A single tweet from a prominent figure can trigger a dramatic price surge or plunge, rendering any prediction based on historical data obsolete. Similarly, regulatory announcements, such as new laws or bans, can drastically alter market dynamics, making it extremely difficult for algorithms to anticipate these shifts.
The lack of incorporation of these real-time, qualitative factors into quantitative models creates a fundamental limitation in their predictive power. For example, the 2021 regulatory crackdown on cryptocurrency exchanges in China resulted in significant price drops that were difficult, if not impossible, for most machine learning models to foresee.
Examples of Machine Learning Model Failures
Several instances demonstrate the limitations of machine learning in accurately predicting cryptocurrency crashes. Many models failed to predict the significant Bitcoin price drop in late 2018, which saw a decline of over 80% from its all-time high. Similarly, the flash crash in May 2021, which saw a sharp and sudden drop in the price of several major cryptocurrencies, caught many machine learning-based prediction systems off guard.
These failures highlight the challenges of accurately predicting events driven by unpredictable human behavior and unforeseen regulatory changes.
Comparative Effectiveness of Different Machine Learning Algorithms
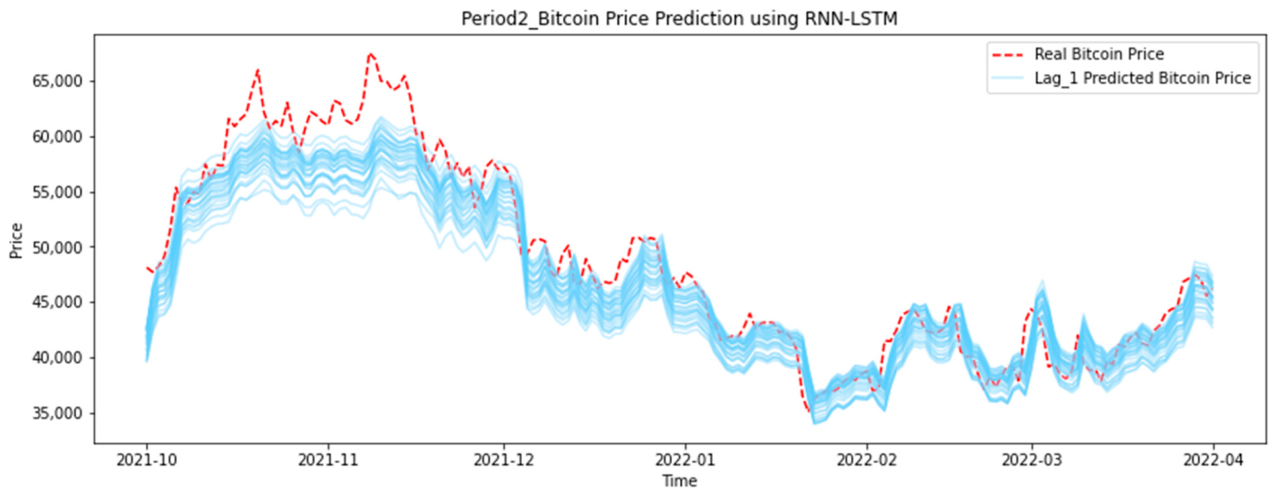
Different machine learning algorithms exhibit varying degrees of effectiveness in forecasting cryptocurrency price movements. Recurrent Neural Networks (RNNs), particularly Long Short-Term Memory (LSTM) networks, are often employed due to their ability to handle sequential data. However, even LSTMs struggle to capture the extreme volatility and the influence of external factors. Autoregressive Integrated Moving Average (ARIMA) models, a traditional time series forecasting technique, are also used, but they often perform poorly when faced with the non-stationary nature of cryptocurrency price data.
While LSTM models can potentially capture complex temporal dependencies better than ARIMA, their reliance on historical data makes them vulnerable to unforeseen events and regime shifts in the market. Neither approach consistently outperforms the other in predicting crashes, highlighting the overall limitations of machine learning in this context. The inherent unpredictability of the market often renders even the most sophisticated algorithms ineffective.
Data Sources and Feature Engineering for Price Crash Prediction: Can Machine Learning Algorithms Predict Cryptocurrency Price Crashes?

Accurately predicting cryptocurrency price crashes requires a sophisticated approach to data acquisition and feature engineering. The success of any machine learning model hinges on the quality and relevance of the input data. Poor data leads to unreliable predictions, while carefully selected and engineered features can significantly improve model accuracy and robustness.Data quality is paramount. Inconsistent data, missing values, and outliers can severely skew model training and lead to erroneous conclusions.
Therefore, rigorous data cleaning and preprocessing are essential steps. This involves handling missing values (e.g., imputation or removal), smoothing noisy data, and identifying and addressing outliers. The selection of relevant features is equally critical; including irrelevant features can introduce noise and reduce model performance, while omitting crucial features can lead to incomplete and inaccurate predictions.
Crucial Data Sources for Cryptocurrency Crash Prediction
Several data sources offer valuable insights into market dynamics and can be incorporated into predictive models. These sources provide different perspectives on market sentiment, trading activity, and blockchain-level information. Combining these diverse data streams can lead to a more comprehensive understanding of market behavior and improve the accuracy of crash predictions.
| Data Source | Strengths | Weaknesses | Example |
|---|---|---|---|
| Trading Volume | Indicates market activity and potential shifts in demand. High volume preceding a crash can be a significant indicator. | Can be manipulated; doesn’t always directly correlate with price movement; susceptible to wash trading. | A sudden and significant increase in Bitcoin trading volume on major exchanges preceding a price drop. |
| Market Capitalization | Provides an overall picture of the market’s size and health. Sharp declines can signal vulnerability. | Doesn’t capture the nuances of individual coin performance; sensitive to the price of the dominant cryptocurrencies. | A substantial decrease in the total market capitalization of all cryptocurrencies. |
| Social Media Sentiment | Reflects public opinion and can provide early warning signs of potential crashes, driven by fear, uncertainty, and doubt (FUD). | Prone to manipulation; sentiment analysis can be challenging due to the informal nature of online communication; difficult to quantify accurately. | A surge in negative sentiment on Twitter and Reddit regarding a specific cryptocurrency. |
| Blockchain Metrics | Provides on-chain data like transaction fees, network hash rate, and active addresses. Changes in these metrics can signal shifts in network activity and user confidence. | Can be complex to interpret; requires specialized knowledge of blockchain technology; may not always be readily available for all cryptocurrencies. | A significant drop in Bitcoin’s transaction fees, potentially indicating reduced user activity and decreased demand. |
Feature Engineering and Transformation
Raw data rarely provides optimal input for machine learning models. Feature engineering involves transforming raw data into features that are more informative and relevant for the model. This process can significantly improve model performance. For example, technical indicators like moving averages, relative strength index (RSI), and Bollinger Bands can be derived from price and volume data to capture momentum and volatility.
Social media sentiment data can be transformed using natural language processing (NLP) techniques to quantify sentiment scores. Blockchain metrics can be aggregated and normalized to make them comparable across different cryptocurrencies. Furthermore, time-series features like lagged variables and rolling statistics can capture temporal dependencies in the data, which is crucial for predicting price crashes. Feature scaling techniques, such as standardization or normalization, ensure that features have a similar range of values, preventing features with larger magnitudes from dominating the model.
Dimensionality reduction techniques can help reduce the number of features, improving model efficiency and preventing overfitting. For example, Principal Component Analysis (PCA) can be applied to reduce the dimensionality of the data while retaining most of the variance.
Model Training and Evaluation Metrics
Training a machine learning model to predict cryptocurrency price crashes involves several crucial steps. The process begins with selecting an appropriate algorithm, considering factors like data characteristics and desired prediction accuracy. Subsequently, the chosen algorithm is trained using a historical dataset of cryptocurrency prices and relevant features. The model learns patterns and relationships within the data to identify potential indicators of price crashes.
Finally, the trained model is rigorously evaluated using appropriate metrics to assess its predictive performance.The selection of appropriate evaluation metrics is critical for understanding the model’s strengths and weaknesses. These metrics provide quantitative measures of the model’s ability to correctly identify price crashes (true positives) and avoid false alarms (false positives). Different metrics offer different perspectives on performance, and the choice depends on the specific goals and priorities of the prediction task.
Evaluation Metrics for Cryptocurrency Crash Prediction
Common evaluation metrics used in binary classification problems, such as predicting cryptocurrency price crashes (crash or no crash), include precision, recall, F1-score, and the Area Under the Receiver Operating Characteristic curve (AUC). Precision measures the accuracy of positive predictions, representing the proportion of correctly predicted crashes out of all predicted crashes. Recall measures the model’s ability to identify all actual crashes, representing the proportion of correctly predicted crashes out of all actual crashes.
The F1-score balances precision and recall, providing a single metric that considers both aspects. AUC summarizes the model’s performance across different classification thresholds, providing a measure of its overall discriminatory power.For example, a model with high precision but low recall might accurately predict crashes when it does, but miss many actual crashes. Conversely, a model with high recall but low precision might correctly identify most crashes but generate many false alarms.
The F1-score offers a compromise between these two extremes. A high AUC indicates that the model effectively distinguishes between crashes and non-crashes across a range of classification thresholds.
Interpreting Model Evaluation Results and Areas for Improvement
Interpreting the results involves analyzing the values of these metrics in relation to the model’s purpose. For instance, a high precision might be preferred in a scenario where false alarms are costly (e.g., triggering unnecessary sell-offs). Conversely, a high recall might be more important when missing a crash is significantly more detrimental than generating a few false positives.If the model performs poorly (low F1-score, low AUC), several areas can be investigated for improvement.
This could involve exploring different algorithms, refining feature engineering techniques to include more relevant predictors, adjusting model hyperparameters, or increasing the size and quality of the training data. Data imbalance (significantly more instances of “no crash” than “crash”) is a common issue that can be addressed through techniques like oversampling or undersampling.
Ethical Considerations of Using Machine Learning for Financial Market Prediction
The use of machine learning models for predicting financial market events, including cryptocurrency price crashes, raises several ethical concerns. One major concern is the potential for market manipulation. If a model accurately predicts crashes, individuals with access to the model could exploit this knowledge for personal gain, potentially destabilizing the market. Furthermore, the opacity of some machine learning models can make it difficult to understand their decision-making process, raising concerns about fairness and transparency.
The potential for algorithmic bias, leading to discriminatory outcomes, also needs careful consideration. Responsible development and deployment of such models necessitate robust safeguards to mitigate these risks and ensure fair and equitable market access for all participants. Transparency in model methodology and limitations is paramount to prevent misuse and maintain market integrity.
Alternative Approaches and Emerging Technologies
Predicting cryptocurrency price crashes solely using machine learning faces inherent limitations. A more robust approach involves integrating machine learning with complementary techniques and leveraging emerging technologies that offer richer datasets and novel analytical perspectives. This section explores the potential of combining machine learning with other predictive methods, the role of sentiment analysis, the insights offered by blockchain technology itself, and presents a hypothetical advanced predictive model.The complexity and volatility of cryptocurrency markets necessitate a multi-faceted approach.
Relying on a single predictive method, even a sophisticated machine learning algorithm, can be risky. Combining various techniques offers a more comprehensive and nuanced understanding of market dynamics.
Combining Machine Learning with Fundamental and Technical Analysis
Fundamental analysis assesses the intrinsic value of an asset based on factors like adoption rates, regulatory changes, technological advancements, and overall market sentiment. Technical analysis, on the other hand, focuses on historical price and volume data to identify patterns and trends. Integrating these with machine learning can enhance predictive accuracy. For instance, a model could use machine learning to identify patterns in technical indicators (e.g., moving averages, RSI) and then weight these patterns based on fundamental factors (e.g., network activity, developer activity).
This combined approach can provide a more comprehensive view than either method alone, mitigating the limitations of each.
Sentiment Analysis in Predicting Market Sentiment Shifts
Sentiment analysis, the computational process of identifying and categorizing opinions expressed in text, can provide valuable insights into market sentiment. By analyzing news articles, social media posts, and forum discussions, algorithms can gauge the overall optimism or pessimism surrounding a cryptocurrency. A sudden shift towards negative sentiment can be a strong indicator of an impending price crash. For example, a surge in negative tweets about a specific cryptocurrency, coupled with a decline in trading volume, might suggest an impending price correction.
This sentiment data, when integrated with machine learning models, can improve the accuracy of crash predictions.
Blockchain Technology’s Insights into Market Instability, Can machine learning algorithms predict cryptocurrency price crashes?
Blockchain technology itself provides a wealth of data that can be used to predict market instability. On-chain metrics, such as transaction volume, active addresses, and the distribution of coin holdings, can reveal significant shifts in market dynamics. For example, a sudden increase in large transactions (whale activity) coupled with a decrease in smaller transactions might indicate a potential sell-off.
Machine learning models can analyze these on-chain metrics to identify patterns that precede price crashes. Furthermore, analyzing the network’s hash rate and difficulty can offer insights into the overall health and security of the network, which can indirectly impact price stability.
Hypothetical Advanced Predictive Model
Imagine a model that integrates on-chain data (transaction volume, active addresses, hash rate), technical indicators (moving averages, RSI, Bollinger Bands), fundamental factors (adoption rates, regulatory news), and sentiment analysis (social media sentiment, news sentiment). The model, a hybrid approach using a combination of LSTM networks (for time series data) and gradient boosting machines (for feature importance and non-linear relationships), would ingest this diverse data.
The output would be a probability score indicating the likelihood of a price crash within a specified timeframe (e.g., 24 hours, 7 days, 30 days), along with a confidence interval reflecting the model’s uncertainty. The limitations would include the model’s reliance on historical data, its inability to perfectly predict unforeseen events (e.g., black swan events, major regulatory changes), and the potential for bias in the input data.
Despite these limitations, such a model could offer significantly improved predictive capabilities compared to models relying on a single data source or predictive technique. Real-world examples of such hybrid models are currently under development in the financial sector, though their specific implementations and performance metrics are often proprietary.
Visualizing Model Performance and Insights

Effective visualization is crucial for understanding the performance of machine learning models predicting cryptocurrency price crashes. A well-designed visualization can translate complex statistical results into easily digestible information, enabling both technical and non-technical stakeholders to grasp the model’s capabilities and limitations. This allows for informed decision-making regarding the model’s deployment and potential reliance.Visualizing Model Performance Using a Confusion MatrixA confusion matrix provides a clear and concise representation of a classification model’s performance.
It displays the counts of true positives (correctly predicted crashes), true negatives (correctly predicted non-crashes), false positives (incorrectly predicted crashes), and false negatives (incorrectly predicted non-crashes). Imagine a 2×2 matrix. The top-left cell represents true positives, the top-right cell represents false positives, the bottom-left cell represents false negatives, and the bottom-right cell represents true negatives. Each cell contains a numerical value representing the number of instances falling into that category.
For example, if the model correctly identified 100 instances of price crashes out of 120 actual crashes, and incorrectly identified 20 instances of non-crashes as crashes, these values would be populated in the respective cells. The total number of instances (120 actual crashes + 800 non-crashes) would be displayed in the matrix’s total row and column.
Communicating Model Strengths and Weaknesses to a Non-Technical Audience
Using the confusion matrix as a starting point, the visualization can be simplified for a non-technical audience. Instead of raw numbers, percentages could be used to represent the proportion of correctly and incorrectly classified instances. For instance, we could state: “The model correctly predicted 83% of the actual crashes, and 97% of the non-crashes were accurately identified as such.” This avoids the need to understand the meaning of true positives, false positives, etc.
A bar chart could visually compare the percentage of correctly identified crashes versus incorrectly identified ones, providing a clear picture of the model’s accuracy in predicting crashes. Furthermore, a brief explanation of the potential consequences of false positives (unnecessary sell-offs) and false negatives (missed opportunities to mitigate losses) could further enhance understanding.
Representing Key Performance Indicators and Model Predictions Using Charts and Graphs
Beyond the confusion matrix, several other visualizations can effectively communicate model performance. A receiver operating characteristic (ROC) curve, plotting the true positive rate against the false positive rate at various classification thresholds, visually represents the model’s ability to discriminate between crashes and non-crashes. The area under the ROC curve (AUC) provides a single metric summarizing this performance. A higher AUC indicates better discrimination.
Furthermore, a line graph could show the model’s predicted crash probabilities over time, compared to the actual occurrence of crashes. This allows for a visual comparison of predictions and reality, highlighting periods of accurate prediction and significant deviations.
Examples of Effective Data Visualizations for Explaining Complex Model Outputs
One effective visualization would be a heatmap showing the correlation between different input features (e.g., trading volume, social media sentiment, market capitalization) and the probability of a price crash. This would allow stakeholders to quickly identify the features that are most strongly associated with crash predictions. Another useful visualization would be a scatter plot comparing the model’s predicted crash probability against the actual percentage price drop.
This allows a visual assessment of the model’s ability to predict the magnitude of price crashes. For instance, a strong positive correlation would suggest that the model is reasonably accurate in predicting both the occurrence and the severity of crashes. Finally, a simple bar chart summarizing key performance indicators such as precision, recall, F1-score, and AUC provides a concise summary of the model’s overall performance in an easy-to-understand format.
Each bar would represent a specific metric with its corresponding value clearly labeled.
Concluding Remarks
Predicting cryptocurrency price crashes using machine learning remains a formidable challenge. While advancements in algorithms and data analysis techniques offer potential improvements, the inherent volatility and multifaceted nature of the cryptocurrency market introduce significant limitations. The effectiveness of any predictive model hinges critically on data quality, feature engineering, and a thorough understanding of the complex interplay of factors influencing price movements.
Further research and innovation are necessary to refine these models and enhance their predictive capabilities, but the pursuit of accurate prediction in this dynamic space remains a compelling and ongoing endeavor.